If you’re interested in property investing, it is important that you have access to accurate information. A knowledgeable investor has an advantage over sellers, real estate agents, financial advisors, property developers and other investors.
The current digital technology is the medium that brought quick development in data for the investors. The number of statistics with tools to classify, analyse and filter them has been staggering.
Sadly, everyone is not so adept with numbers. If you are one of those technophobes or one that doesn’t like numbers – you might be at an inconvenience. It is better that you address this weakness in your investing skills.
How to DO it?
1. Create a shortlist.
Making a shortlist is actually the largest and most significant step in the process.
Bulk of data is studied and stands much time for discussion. But with this action, you are primed for success.
There’s certainly a need to research thoroughly on your future investment property more than looking at the indicators. You will not be able to decide well relying only on just these figures instantly. But it will be a quick turnaround to eliminate 99% of the not-so-significant suburbs that are not worth your time. Accordingly, it will be more practical to work along a few ‘maybes’ that you can examine and analyse thoroughly in detail. Although this may require more time, it is best to cover everything that’s needed to be included in your shortlist.
With the availability of the huge data across the internet now – shortlisting is apparently the fastest you would do (though it looks a bit odd).
How does it work?
You would probably ignore a 3% vacancy rate. If you’re going for the best top markets – focus only on the places with lower than that, those within and lower 2% vacancy rates.
As an example, this month, 38% of Australia’s property markets had this within and lower 2% vacancy rate. A huge part of the Australian market, in fact, exceeding a third of the whole market can be eliminated if you apply the filter for vacancies at the first instance.
If we use similar stringent criteria to the rest of the indicators for those suburbs left, then we can discard a lot more bad investment choices. Think of how you can use this to the complete set of indicators. Those that will remain with you will be the finest of all – the top and highly-graded investment property markets. This is the essence of shortlisting. The foremost criteria you have to employ are your personal, distinctive situations.
Specific Criteria for You
Your particular investment strategy as well as financial situation will remove a large number of wrong or inappropriate markets. Your filtering begins here.
Listed below are the different sections that illustrate the process of qualifying for the investors’ regular criteria:
Budget
For example, having a budget of only $500,000 in buying a property – you can forget all markets which have higher prices than that (intended budget). A scenario where $900K is the budget, you don’t mean to discard the $500K property locations. So, why not spread out in two diverse areas?
Location
Some property investors will strategize a DIY for a subsequent purchase. So what they would prefer is an area that’s near their home. A region or post codes search activity might be one option to shortlist suburbs that would qualify. This will help eliminate a significant number of suburbs that are highly improbable.
Cash flow
Several investors are gearing towards the border of functionality. If this is something that applies to you, a much better cash flow property might suffice, your mortgage agent would probably not be restless in your succeeding meeting. Presently,
“Get your Access to our Fully Customisable Investment Property Research and Analytics Tool Now!”
If you check the locations providing higher yields, this will give you a more concise shortlist. But be wary as high-yielding areas don’t necessarily mean good-growth locations. Presently, it is considered high yielding if it is 6.5% or higher.
It is notable that very low vacancy rates put pressure for rents to go up. So, if your goal is more cash flow – just make sure to include in your analysis the unusually small vacancy rates. Any value that’s lower than 2% is a good indicator.
Note: When data like the unpredictable vacancy rates appear in the so-called slightly-rented markets – study the recent months’ numbers. A caution though not to absolutely believe most of the latest reported statistics. A collective set of data showing trends is more indicative.
How to compute for cash flow?
Here’s a case in point for RENT and EXPENSES:
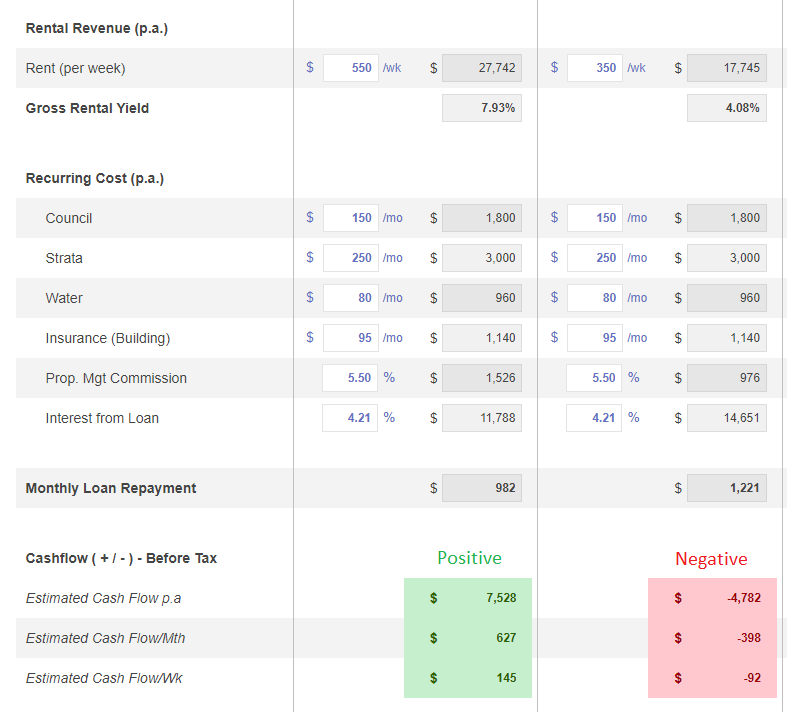
One of the most essential aspects in your research is doing the math for the cash flow of a potential property. While looking for the gross cash flow versus the purchase price with the potential rent is quite simple – some factors when ignored can influence your cash flow standing:
Owners’ rates and strata or body corporate fees
The rates’ amount will most likely be from $1,300 to $1,700 yearly. On the other hand, strata or body corporate fees are typically pegged at $700 to $1,100 annually.
Check out “Crunching the Numbers: Positive Cash Flow vs. Negative Gearing“
Maintenance and repairs
The pricier the property, the greater will its maintenance costs be. A good rule of thumb to apply is this: assume costs between 1% and 1.5% of your property’s value is being redirected towards maintenance and repairs every year.
Depreciation
All buildings do not remain new and of course, get old – in the same way that all assets inside the structure go through the usual wear and tear. With this, we expect that every single year – the value of the property decreases and therefore, depreciates. Check out our Tax Depreciation Calculator to check if this will have an impact to the amount you can collect as tax incentives.
Investor-related Criteria
Capital Growth
Capital growth forms a big part of whatever investment approach you may have in real property. If you have plans of renovating and then selling immediately for profit, the bottom line will be more favourable in a highly active growth market. So how do you find one?
This is an often-heard statement: prices increase when demand outdoes supply. Focus your research based on this economic law of supply and demand; keeping it at the top of your mind.
The technique is to carefully recognize those markets where demand exceeds supply. This is not designed by your gut feels, rather than with an objective manner of studying the statistics. The good news is there is a deluge of figures for any of the country’s property markets that’s readily available in a matter of minutes.
Listed down are some of the indicators you may apply, including the ways to understand them. Suburb data based on these indicators are provided by SuburbsFinder.
Days On Market (DOM)
What’s a good indicator of demand vs. supply? It is Days On Market (DOM) which tells you how many days that a property is left on the market. You can conclude that when there are properties which have high demand but low in supply – surely, they’d be snatched-up in no time at all.
A number of the quickest-moving property markets’ average DOM usually happens less than a month.
Let’s have an illustration:
Geelong houses – appear to have high DOM with 73 days. DOM countrywide on the average was at 177 days, while the midpoint, 154 days.
What does the data tell us? This DOM that’s fewer than 75 days implies quite a robust market in this month. Most of the country’s suburbs had higher than DOM of 73 days. But the fact is that this figure doesn’t suggest that properties in these areas are a ‘must buy’ – it’s just one of the various indicators you can make use of.
Stock On Market (SOM) – Number of For Sale Listings
Stock On Market (SOM) is a supply indicator. With supply as the competitor of growth, SOM should be kept as modest as it can be. There are small markets, others are big – but a better statistic to look up is what is the actual proportion of Stock on Market or SOM.
Sales Growth – Number of Sales
Sales volume movements can indicate upcoming capital growth. If markets begin to be excited, stock which was previously inactive suddenly acts quickly. It is a fact that sales growth may also mean expanding supply. If for instance, 500 homes sprang up in the market instantly due to seeming enormous activities by developers, sales growth will surely escalate even though there is still oversupply.
As with majority of the individual indicators, it is best to highlight a potential suburb and pursue a more in-depth study.
Vendor Discount
In percentages, when you’ve averaged the variance in relation with the asking price and the selling price for the entire property market like a suburb is termed as average vendor discount. But in the so-called hot markets, the vendors/sellers do not have to exert much effort – they usually sell even if they do not reduce much their asking price. Thus, this discount is the best indicator of the demand in relation with the supply. The lesser the value for this discount implies a greater demand versus supply.
Average Annual Capital Growth
The average annual capital growth rate for the last 10 years is considered as long-term growth. If you’re wondering that your market could be on its lucky side, then, that indicates a high value and perhaps, even higher in “double digits.”
A suburb that has a growth rate of below 4% is an area that has not had a recent increase in prices. But this doesn’t mean it is about to, what it really suggests is that you have not passed up this opportunity if it’s happening. Other indicators most likely would measure when that good break is coming along.
Quarterly growth
As the term implies, quarterly growth is last 3 months’ growth. If you are watching for a relatively flat market to surge upward, keep an eye on this particular figure.
Getting the averages per month can be misleading so this three-month digit is a more prudent indicator.
MORE Indicators:
Here are other indicators to consider but unfortunately, time is not enough to discuss each one now. The ones listed below will suffice to get you going. If you’ve studied these topics and interested to learn more, try looking up these subjects:
- Online Market Demand
- Percentage of Renter/Owner Occupier
- Median Number of People Looking for a Room
- Median Number of Rooms Advertised Online
- Total For Rent Listings
- Local Government Area Residential Building Approvals
2. Polish the shortlist you made.
The concept behind this process is to filter the promising hotspots you made in the shortlist from the 1st step. Others may not measure up as you do a second check. There’s a certainty also that you may transfer others to the top in the list after you’ve gathered more valuable information about them.
Below is a list that will tell you exactly what type of research you need to do:
Study the statistics
It’s a fact that these statistics may have inconsistencies. Don’t depend on any of these numbers. Study and select the significant data. For instance, if the stats on cash flow seems crucial – you need to validate the vacancy rate’s value by examining the rental listings’ total count of the suburbs. Check if the available properties for rent match your expectations for the quoted vacancy rate.
Watch out also for the yield. Examine the comparable properties that are being sold which closely resemble the suburb and the for-lease properties’ qualities. While studying the ‘for sale properties’- you need to know if the stats is similar to the listed stock on market, too.
Oversupply is what can have an adverse effect on all your shortlisted priority suburbs. There’s a possibility of upcoming developments that can overwhelm the market. You want to know that this is not occurring at all. Search for the local council lists on approved applications for new developments. Evaluate the magnitude of each one by the kinds and quantity of houses.
The argument here is to determine the count of properties which are about to emerge in the market. You are obliged to calculate supply in the near future.
Note: A number of Local Government Areas (LGAs) are big and apparently will have an enormous batch of applications. Search for the LGA’s residents and compare it with the extent of the building activities. Do this many times over so you’d get a reasonable idea of the scope of numerous building activities. Take note that supply is counter to price escalations. As a whole, you do not like the idea of extensive developer activity. Actually, you don’t want it. Period.
Public spending
Will public spending build-up or lessen with the suburb’s appeal to its population? Public spending is derived from the state or federal governments and the local council – mostly counting on the infrastructure projects. The low-impact projects, on the other hand, are more of the local council’s responsibility. Some examples are: nature strips improvement or expansion of a business centre.
Private spending
Investment by the large and solid companies is what is considered as private spending. This is beneficial to availability of employment openings. It will do you good to study where the banks, restaurants, coffee shops, supermarkets, hardware or home specialty centres are opening up their new shops or branches. Others which also push demand are the schools/universities and private hospitals.
The recent changes or improvements are more significant than the existing characteristics. You might look for a location with good transport system, reputable schools and premier shopping destinations. However, if these features have been there for about a good number of years, say 12 years, and still remaining in place – these qualities likely have been already factored-in the market price.
Get in touch with local realtors
Find some local real estate reps and seek out their expertise about the present market conditions and what they believe will be the situation in the near future. Let them provide the reasons for their assumptions. If you contact them through your phone – check if you might want to still proceed into the 3rd step below of the research you’re doing.
3. Do street-level research.
Such process ensures you will be knowledgeable about the suburb down the line- yes, the street level.
Inquire from agents
You can begin your research by asking the real estate agents of the locality for any trouble areas or ‘no-go’ spots. Observe if there are any barriers which include mass housing commission homes.
Check from the agents the places where the ideal locations are, something which they would acquire for themselves if they’ve got the cash.
Study with a map
Study everything with a map. Check for vacant lands, trees, parks, streetscape as well as closeness to the amenities. The best strategy is for you to go where the street views are. What’s suggested is a downright drive, circling around the area. Deliberation over the map for maybe 30 minutes or more will exactly emphasize what needs to be seen.
The benefit of using the map is looking for places wherein a stone’s throw away from the most essential amenities, but distant enough from undesirable zones.
Note: Somewhere near some of the facilities and amenities may be considered as a bit of constraint for many probable tenants. There has to be a balance so they can enjoy some peace and privacy.
What are some of the undesirables? Can include the following:
- Busy main roads, intersections, thoroughfares
- Skate parks
- Dimly-lit streets and avenues
- Small alleys
- Industrial spots
- Vacant lots where development is a possibility
- Service stations
Go for a visit
If you go around for a walk around the suburb, try to see and examine the following which you can’t discover in online research:
- Pedestrian Quantity/Shopper location and foot count
- Traffic flow and volume of vehicles
- Sights and views, including terrain
- Various smells (from sea/factories/sewage systems)
4. Do property-level research
There are few properties to take up in high growth locations as the supply is inadequate. But the good news is that you can have options.
Best Property Type
Inquire from the local agents the type of property that appeals most to the renters and buyers. What are their usual choices? An apartment or a house? A condo or townhouse or perhaps, something different from all these? What standards do they look for in a finish?
In case you see an ideal for sale property at the moment, inquire from another agent and ask him about his thoughts and opinions.
Find a stand-out property in areas like character-laden neighbourhoods and some homes that are unique and quirky. Ask the local agents if these types of houses spur demand as well.
Properties within the Vicinity
The pictures you see online will not be enough. It may give you an inkling of how the house you’re interested in looks like but what about the neighbouring houses? They’re most often not included. Check out the houses around to be sure you are not getting the most perfect house, albeit on a worst street or location.
Orientation
Just keep in mind that in Canberra and other areas where climate is cooler – having enough exposure to the morning sunlight is quite essential. This is the opposite for Perth, for instance, where sun protection is a critical matter.
Price Offering
It’s a must to read through old sales reports for you to get the picture of the fair value. You’ll never expect a deal for a bargain as these are quite tight markets. Down the road, you will know what these sellers would want to receive as they push your back. Be ready to give big bucks in exchange for the outstanding markets.
Conclusion
It is necessary to keep in mind the general rule of the basic principle that’s demand and supply or vice-versa. Make it the top priority as you continue your assessment. You are getting there and right on track.
Don’t be dependent on just a single data metric when you research do analysis.
If you have more data, the less are the risks. You will make wiser investment decisions. It’s practical to check history so go for those charts. Never fully swallow the recent month’s statistics.
Take advantage of our fully customisable tool to help you in choose which areas have both Good Capital Growth and Positive Cash Flow and utilize it to be on top over the less-knowledgeable property investors, local real estate representatives, developers and owners. It lets you narrow down 15,000+ suburbs by combining all 40 data points as filters. It also lets you compare suburbs historical & current performance. And once you identified the best location our tool also lets you do feasibility studies on 5 properties all at the same time. Save time, budget, and cover the full cycle of your investment property research workflow.
So, if you think what we’ve built will drastically decrease your time researching for the best location and finding the right property based on your goals and financial situation, why don’t you sign up and give it a try.
“Get your Access to our Fully Customisable Investment Property Research and Analytics Tool Now!”
It is the most comprehensive location report of all 15,000+ suburbs in Australia – with linked state, suburb, and postcode. It’s the perfect tool for property investors looking to buy a property to rent out rooms individually to have a positively geared portfolio.