In the past, real estate data was primarily driven by educated guesses, conjectures, and hunches. As you would expect, this often led to losses among investors. Today, it is possible to make data-driven investment property decisions based on research-backed by investment property analytics.
This will help you identify the most profitable opportunities in the real estate market and reduce your risk. In this article, we will show you ten important real estate data to look at and understand.
This is the number of days a property is listed for sale before finally being sold. DOM starts as soon as the real estate agent starts advertising the property for sale and ends when the property is paid for.

DOM is an essential investment property statistic that shows the relative rate of demand and supply. An area with a low DOM figure (below 30 days) will likely be a hot market where new properties are closed on quickly. This is a sure sign that demand exceeds supply.
A high DOM score, however, means that there is low buyer interest or a lot of competition in the area, so it may take a long time for properties to sell. A low DOM means that prices are likely to go up. A high DOM (above 30 days) isn’t always a deal-breaker as it may take longer to sell in some locations than in others.
2. Rental Yield
The rental yield is a measure of how much a property earns in a year. Rental yield is calculated as a percentage of the property value and is a good indicator of a property’s cash flow for investors.
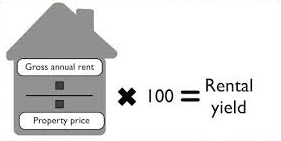
You can calculate the gross yield by dividing the annual rent by the value of the property and multiplying by 100 to get the percentage. For example, if the weekly rent for a property is $500 and the property value is $650,000, the gross yield will be 500 x 52 weeks ÷ 650,000 x 100 = 4%.
“Get your Access to our Fully Customisable Investment Property Research and Analytics Tool Now!”
Renting offers greater flexibility than other forms of property ownership. When a location becomes attractive, renters are the first to make a move on it. A high rental yield, above 6%, means that investors get more cash flow (positive cashflow) from the property, which improves their return on investment.
3. Capital Growth
Capital growth is the increase in the value of your property over a period of time. It is calculated by comparing the current value, also known as the market value of the property, with the amount paid on the original purchase.

This is how most Australians make money in the property market. By buying a property and holding it until it goes up in value before re-selling at a profit. They make money even without doing anything to the property but, in some cases, it pays to invest in improving the property’s value.
Long-time industry expert, Michael Yardney, defines good capital growth as inflation plus 4% to 5% annual growth over the long term. So, you are probably looking at growth rates between 6.5% and 7.5%. Aim for growth rates of 5% or 7% or 8% and above.
The rate of capital growth is determined by the relationship between demand and supply. High capital growth means that demand for that property is higher than supply. Other factors include the economy, population changes, and Infrastructural improvements in the vicinity.
4. Household Income

The household income of residents has a significant relationship with house prices in their neighbourhoods. A 2016 analysis completed by the Australian Taxation Office produced a list of the 10 highest-earning postcodes across the country. Coincidentally, these were also the areas with very expensive property, showing that a big salary equals a big dwelling value.
So, if you’re wondering if household income correlates with house prices in their neighbourhoods, the answer is yes. For the most part, if wages grow in a particular area, it stands to reason that house prices will follow as the purchasing power of residents increases and properties become harder to find.
However, wage growth doesn’t always equal property growth as house prices have soared in many major cities since 2009 while most household income remained stagnated. The income range of households is an important factor investment property analytics take into account when deciding on asset locations.
5. Vacancy Rate
This is a measure of the number of rental properties in an area and the number of units that are vacant at any given time. If we have 500 rental properties and 25 of them are vacant, our vacancy rate will be 25 ÷ 500 x 100 = 5%.
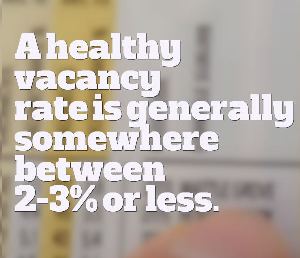
The vacancy rate tells real estate investors how secure their rental income is, allowing them to adjust their investment strategy. Areas with a low vacancy rate will ensure a better yield for investors as their properties are less likely to remain vacant after a tenant moves out. You can use the vacancy rate to project a fairly accurate return on investment. A vacancy rate of 3% is considered healthy because it represents a market balanced between tenants and owners. Areas with vacancy rates of less than 2% mean high rental demand while vacancy rates above 4% mean that there is more rental housing supply than demand. A low vacancy rate is considered positive because it generally means that the area is desirable, and people want to live in the area.
6. Rental Listings (Rental Stock)
The rental listing is the number of properties advertised for rent compared to all properties in that area. For example, if there are 500 properties in an area and 120 of them are currently listed for rent, then the rental stock is 24%.
The rental stock is an indicator of supply as the higher the percentage the more properties are in supply for renters. Areas with a high rental listing may have more properties for rent than available renters.
7. Sale Listings (Stock on Market)
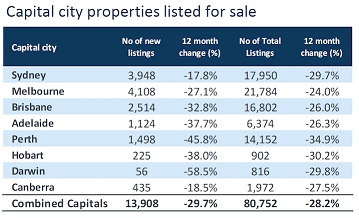
The sale listing or stock on market is the number of properties available for sale. It is usually presented as a percentage and calculated similarly to the rental stock. The sale listing percentage is used to indicate the level of supply as a low score could mean there is a higher demand than supply.
However, this is not always the case. It could also be that people are just holding off and not selling. Or the properties on that area are tightly held because most residents are owner occupiers, which could lead to pushing up the house price due to exclusivity. If you are looking for assets with capital growth potential, you should look out for property markets with low stock on market figures. A high stock on market percentage means that there is more supply than demand and as a result, lower capital growth.
8. Online Listing Market Demand (Online Search Interest)

The online listing market demand is the ratio of people searching for properties online compared to the number of all available properties for sale. This is an indicator of the rate of demand from would-be buyers against the supply of properties for sale.

A higher online listing market demand trend means that demand outweighs supply and this can influence the price growth of properties within the area. A low score means that people are losing interest in that property.
A monthly trend of 12 months or more will show which areas are slowly gaining market attention or the other way around.
The online listing market demand can be unreliable if you can’t distinguish between a new visitor and an old one. But if a visitor keeps revisiting a property it can also be considered a show of interest. This number can be verified by visiting the property in question during open inspections and taking a quick count.
9. Median Price
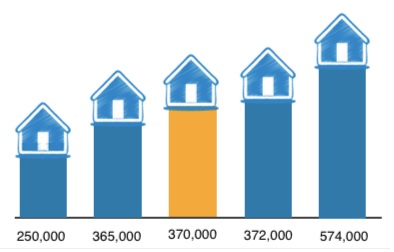
The median price is the middle point for real estate prices over a given period, usually a month. It is calculated by compiling all the property sale prices in a month and then taking the middle figure.
This helps investment property analysts to detect changes in the market by tracking the movement of property prices. However, while median prices help us understand the price changes of properties, they do not necessarily mean a change in your property’s value.
Property investors should not rely on median price alone as they are easily influenced by several factors. A rising median price may be caused if several multi-million-dollar homes are sold during the month, even if the prices of other properties remain stable. Similarly, a falling median price can result from more sales of cheaper properties over the course of a month.
For example, if 10 properties are sold and 8 are $1M each while 2 are $500k each, you will have a median price of $1M. On the other hand, you will get a median price of $500k if 8 properties are sold for $500k and 2 for $1M each. For more accurate research, you can combine the median price with the average price of properties sold within the same period.
10. Percentage of Owner & Renter
This is the proportion of renters living in a property market compared to all people living in that area. We calculate this by categorizing all the people that live in an area into two groups: renters and owners.
If a property market has a population of 3,000 and 1800 are occupied by owners while 1200 are tenants, the percentage of renters would be 40%. This figure is important because owner-occupiers are generally more likely to take better care of their properties and increase their value over time.
So, areas with a lower percentage of renters will generally be more attractive than property markets with a higher percentage of renters. Also, a low percentage of rental properties means that you have less competition if you plan on putting your property up for rent.
Combining Different Data Points
Combining different data points and understanding their relationship against each other help make a data driven investment property decision. One example would be, when the vacancy rate is low, the days on market is low, and the percentage of the owner is more than renters.
A low vacancy rate and days on market score mean that properties in the area are high in demand and more likely to appreciate over time. A high percentage of owners means that there is less competition if you plan on renting.
Another example is when the vacancy rate is low, the median price is below $500k, the rental yield is more than 5%, and the capital growth is above 6%.
A low vacancy rate is always desirable but a median price below $500k has to be verified against the average prices of properties in the area.
A 5% rental yield shows the cash flow from the property, which is not so great but not bad either. While a capital growth above 6% shows that the value of the property will likely go up in value even without developing it. In this case, you can either hold on to the property while getting a decent return and for some years sell it for a profit.
Conclusion
The best advice we believe we can give you is not to go after every glittery and shiny thing you find in the market. It is important that you carry out your research and due diligence when planning to invest in property to make a data driven investment property decision.
Our fully customisable tool will help you in choosing which areas have both Good Capital Growth and Positive Cash Flow. It lets you narrow down 15,000+ suburbs by combining all 40 data points as filters. It also lets you compare suburbs historical & current performance. And once you have identified the best location, it also lets you do feasibility studies on 5 properties all at the same time. Thereby saving time, budget, and covering the full cycle of your investment property research workflow
So, if you think what we’ve built will drastically decrease your time researching for the best location and finding the right property based on your goals and financial situation, why don’t you sign up for free and give it a try.
It is the most comprehensive location report of all 15,000+ suburbs in Australia – with linked state, suburb, and postcode. It’s the perfect tool for property investors looking to buy a property to rent out rooms individually to have a positively geared portfolio.