Almost every real estate agent will sell properties based on several attractive points: neighbourhood, amenities offered, whether there are picture windows or bay windows, and more, but take some caution. As property investors, the most important thing to consider really is the potential for capital growth and supply and demand are the only two variables that can drive this.
Relative to supply, prices will generally increase if buyers’ demand for properties is high. The reason: buyers will compete to get what they want so much. As supply becomes limited, the pressure to get what they want becomes more challenging as less is available.
In doing property investing, we should look for markets showing a high demand to supply ratio when we are ready to buy a property. This is to ensure that capital growth will happen fast, and we will have enough equity to help us with the next purchase.
For areas having a high demand to supply ratio, we need to act fast as “nothing lasts forever”. Astute investors and developers are always looking. As property prices start increasing in such suburbs, demand slows down. And over time, developers who took opportunity of the high demand will have built additional projects, thus increasing the supply. The market re-adjusts to a balanced proportion of demand vs. supply down the road. As they say, practical and sound investing is all about recognising and maximising the imbalances.
The question is: What are the indicators that we need to know when demand exceeds supply so we can make an accurate comparison of suburbs?
“Get your Access to our Fully Customisable Investment Property Research and Analytics Tool Now!”
.
Listed below are the eight TRENDS that every property buyer or investor should watch out for:
1. LOW DAYS ON MARKET. If demand is higher than its supply, most buyers are certainly inclined to snap up these properties quickly. Thus, the length of time one property is advertised in the market decreases, translating to lower Days on Market (DOM).
2. HIGH ONLINE LISTING MARKET DEMAND. When many buyers look for properties in an area or suburb where there’s not enough available properties for sale, interest is high which makes the demand exceed the supply.
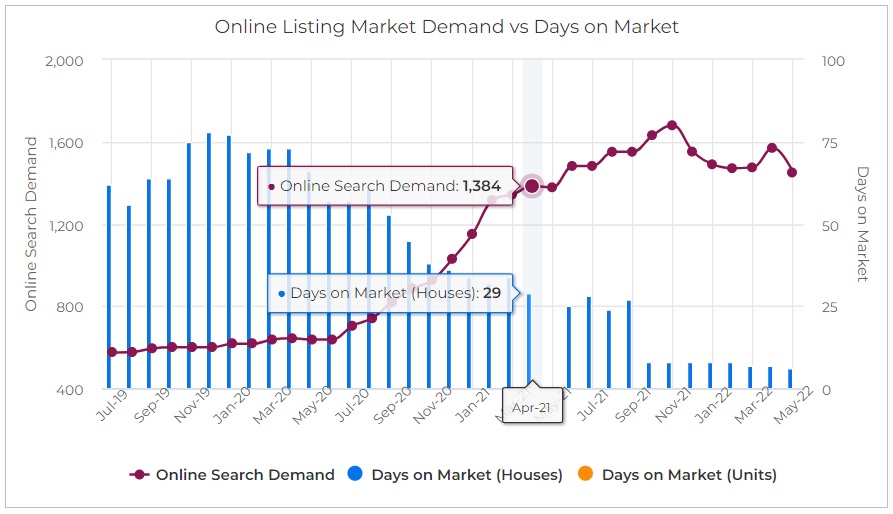
SuburbsFinder lets you overlay Days on Market versus Online Listing Market Demand to provide a better understanding on what’s happening in a particular suburb
.
3. LOW VACANCY RATE. If the market’s vacancy rate is low, this means that there is not enough rental accommodation as compared to the number of tenants looking in the market.
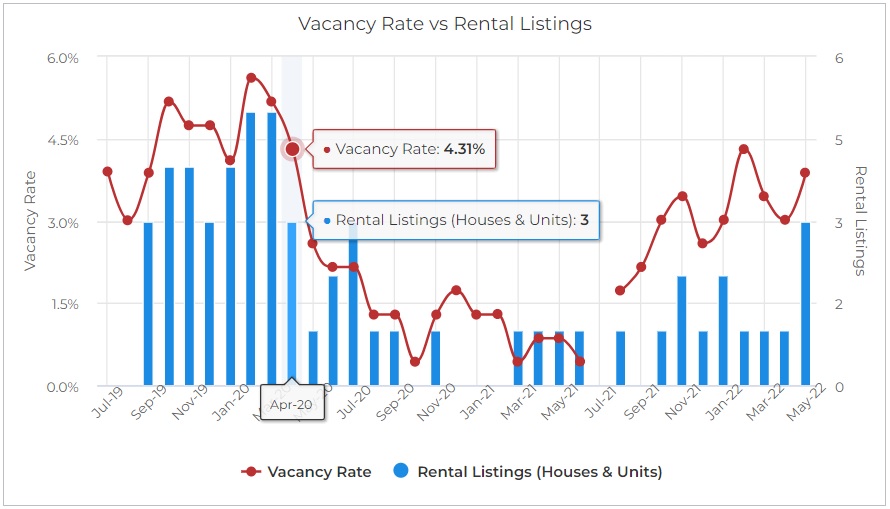
Due to Vacancy Rate being post code level, SuburbsFinder overlays it against the Total Rental Listings to provide clearer rental demand performance of a suburb
.
4. LOW NUMBER OF FOR SALE PROPERTIES. A low amount of stock on the market as a proportion of total properties in the area signifies that properties are tightly held by their owners. Any property that comes on market are quickly snapped up by buyers.
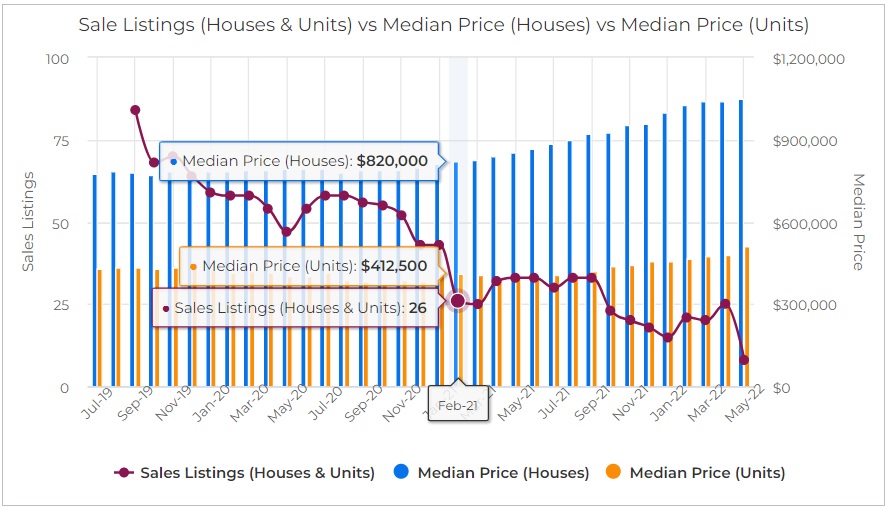
SuburbsFinder overlays Sale Listings with Median Price for both Houses and Units showing the impact on price when supply can’t keep up with the demand
.
5. LOW PROPORTION OF RENTERS TO OWNER OCCUPIERS. Owner-occupiers generally handle their properties better than landlords and tenants. In terms of demographics, most, if not all, renters’ socio-economic standing is lower than the owner-occupiers. Thus, less competition to look for a tenant among landlords happens if the total number of renters in the market is small. So, a low proportion of renters is actually favourable to the market. The number is essentially what the supply (rental accommodations) represents.
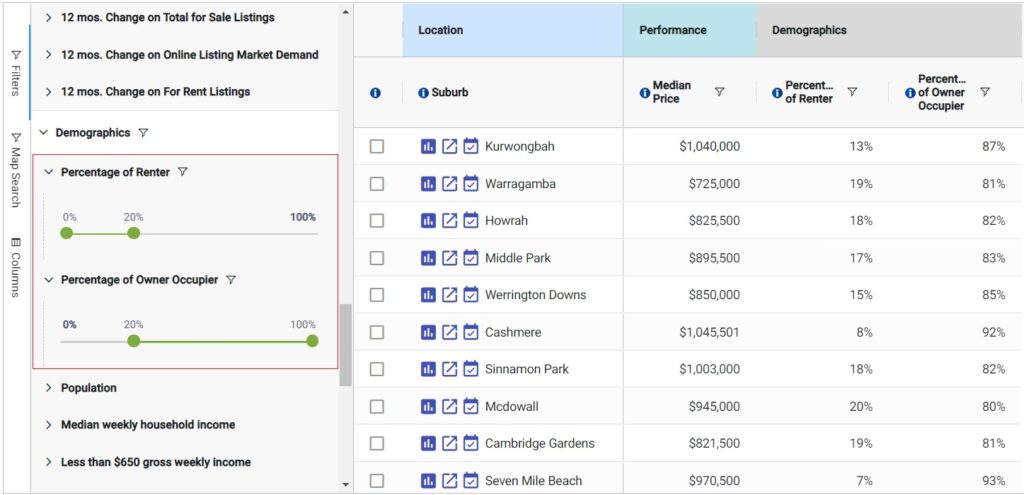
SuburbsFinder enables you to filter the Percentage of Renter and Owner Occupier to all 15,000+ suburbs in Australia
Check out “How to Use Demographics Data for Research in the Property Market?“
6. INCREASING RENT. Increasing rent is a capital growth indicator. Remember that generally, tenants are more agile than owner-occupiers. It is a fact that it is easier to rent than get a loan or mortgage. So, you will notice that tenants normally are the first ones who move in areas that are becoming popular. And this puts a higher demand on rents, thereby increasing them. The investors stride into these markets for its good returns. Then, the owner-occupiers finally take action. Some renters at this point can choose and decide to buy. All these buying activities now put pressure on the prices of the properties.
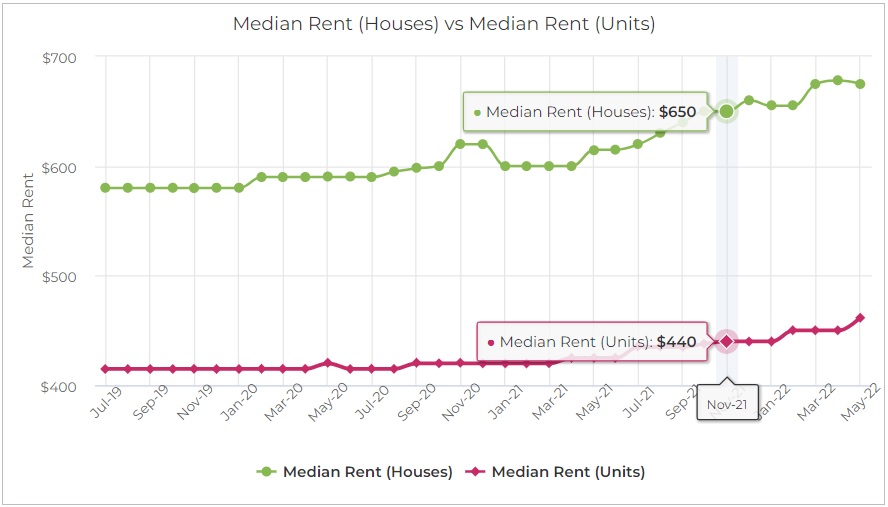
SuburbsFinder overlays Median Rent for both Houses and Units to provide better insights on rental performance and rental difference between the two
7. LOW DISCOUNT. If there’s low demand, sellers tend to reduce their prices to entice buyers. If the discount is minimal or down, there is high demand.
“Get your Access to our Fully Customisable Investment Property Research and Analytics Tool Now!”
.
8. HIGH AUCTION CLEARANCE RATE. For auction clearance, a soaring clearance rate is equal to strong buyers’ demand, although not all properties for sale go to auction.
.
Conclusion
It is necessary to keep in mind the general rule of the basic principle that’s demand and supply or vice-versa. Make it the top priority as you continue your assessment. You are getting there and right on track.
Don’t be dependent on just a single data metric when you research do analysis.
If you have more data, the less are the risks. You will make wiser investment decisions. It’s practical to check history so go for those charts. Never fully swallow the recent month’s statistics.
Take advantage of our fully customisable tool to help you in choose which areas have both Good Capital Growth and Positive Cash Flow and utilize it to be on top over the less-knowledgeable property investors, local real estate representatives, developers and owners. It lets you narrow down 15,000+ suburbs by combining all 40 data points as filters. It also lets you compare suburbs historical & current performance. And once you identified the best location our tool also lets you do feasibility studies on 5 properties all at the same time. Save time, budget, and cover the full cycle of your investment property research workflow.